
In their work, engineers and scientists need graphs - it is difficult and time-consuming to build them. But thanks to new technologies, this can be done easier and more conveniently.
In their work, engineers and scientists need graphs - it is difficult and time-consuming to build them. But thanks to new technologies, this can be done easier and more conveniently. The Origin utility will help you with this.
Origin is cooler than other programs
Origin has two advantages over other utilities . The first is to auto-update a chart of any complexity. You make changes to data or parameters, and the utility itself draws a new graph. This is especially useful for anyone looking for templates for repetitive tasks.
The second advantage is that you can make Origin friends with applications such as MATLAB, LabVIEW, MS Excel, or customize your integration in C and Python.
What Origin can do
Creation of charts of any type
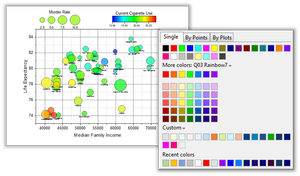
Origin has over a hundred types of charts built in. You can customize them for yourself: create groups with a similar structure, create templates, combine several charts into one and split single-layer charts into several layers. By the way, the appearance of the chart can also be changed: select lines, symbols, column patterns.
Data exploration
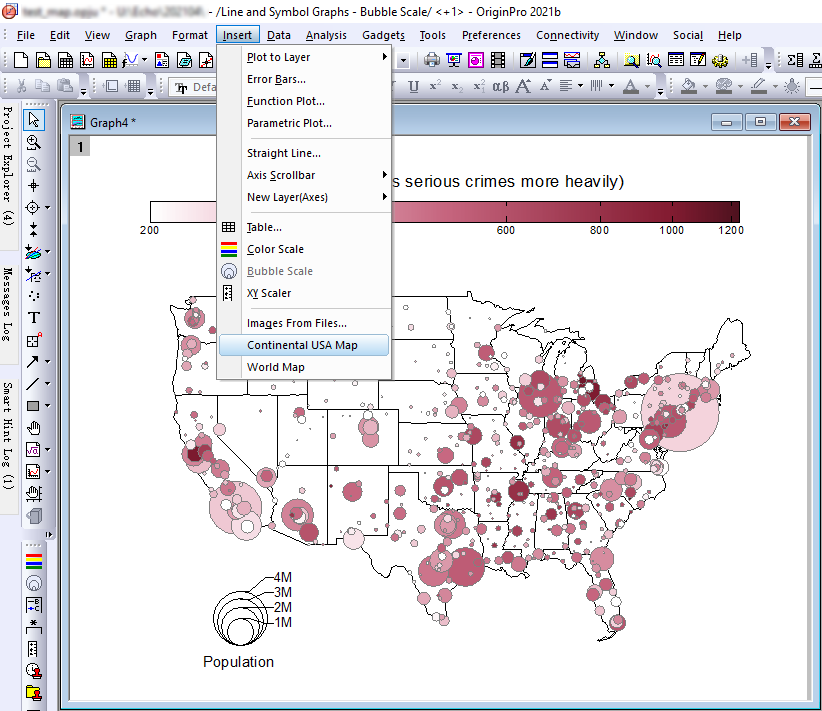
The utility has some cool data mining tricks. For example, you can zoom in on the area of the graphs, zoom and pan them to the desired X / Y scale. If necessary, you can enlarge the area and display the details in the second layer, exclude individual points from the analysis or not display them. Origin can do all this.
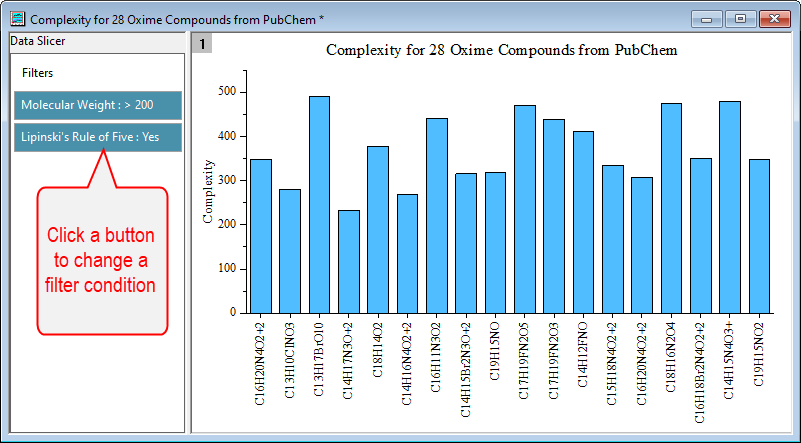
Another useful feature is Data Slicer. It helps to change the filtering conditions immediately on the graph to facilitate research. To do this, you need to set filters for the required columns of the worksheet, create a graph with one or more layers and turn on the Data Slicer panel.
Exploratory analysis
Origin has exploratory analysis gadgets. For example, the Quick Peak Gadget is suitable for interactively finding peaks, subtracting a baseline, and integrating data peaks from a graph. And Quick Fit will perform linear, polynomial, or non-linear curve fit on data plots as a graph. And these are just two examples, there are even more gadgets.
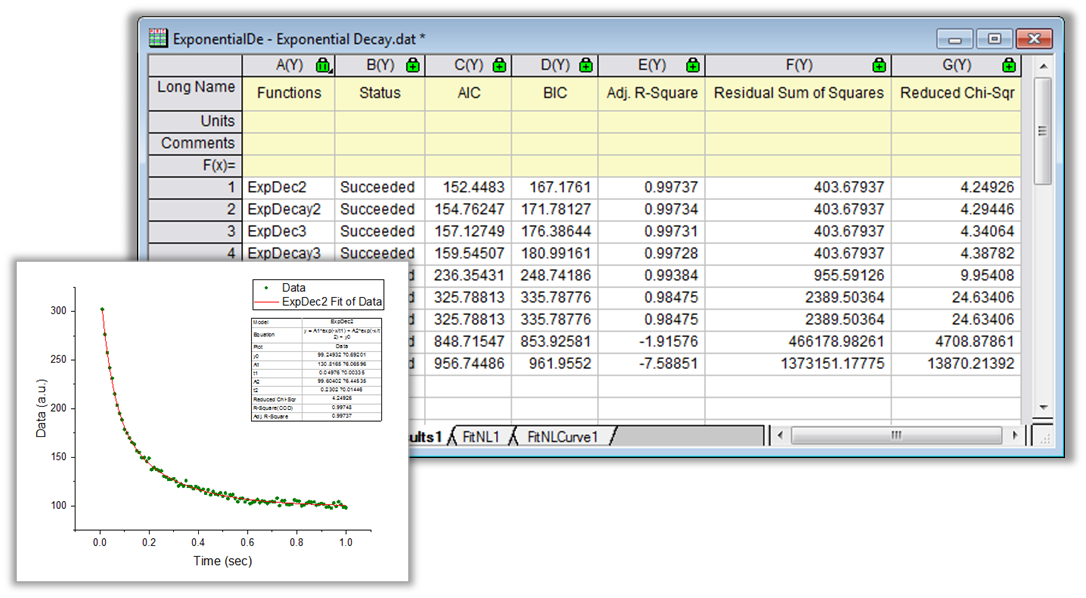
Fitting curves and surfaces
Origin has a variety of tools for linear, polynomial and nonlinear curve and surface approximation. Modern algorithms are responsible for this.
Peak Analysis
You can use chips for baseline correction, detection, integration, and peak matching. There are several options for batch analysis of peaks in datasets.
Statistical analysis
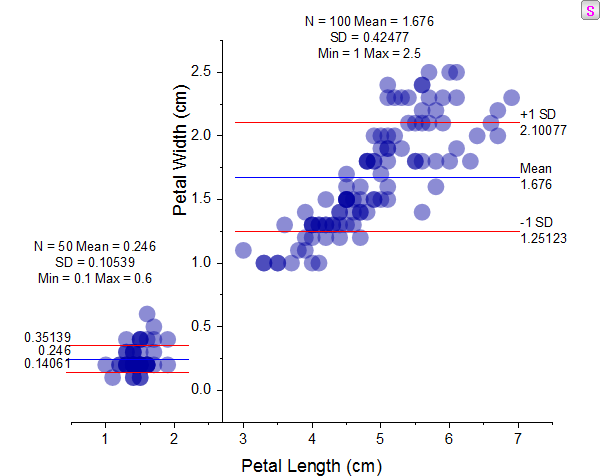
Origin has statistical analysis tools. For example, column or row statistics, cross tabulation, 1D and 2D frequency counting, discrete frequency, normality test, and much more.
The Stats Advisor app helps you interactively select the right statistical test, analysis tool or application.
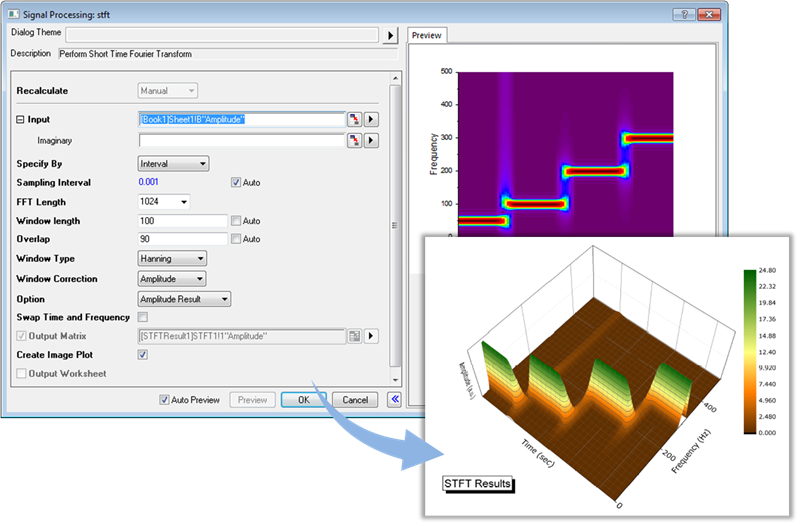
Signal processing
Most signal processing tools are a preview window with zoom controls and additional interactive features (such as a vertical cursor to set cutoff frequencies).
Mathematical analysis
There are also a lot of tools for mathematical analysis of tables and matrices in the utility - from simple column calculations to interpolation, calculus and integration.
Data processing
Data processing before analysis can be carried out immediately after importing into the utility in order to quickly and visually bring the data into the desired form.
Import and export
The main feature of import to Origin is speed, it is 10 times faster than in Excel 2016. You can quickly copy and paste data from Excel to Origin without losing accuracy. The utility supports over 30 import formats.
There are options for export and presentation too, from sending graphs to PowerPoint to making movies. The graph can be scaled to the desired width and exported in vector or raster format for sending to scientific publications.
Project and data management
Working with projects in Origin is also convenient. All data, metadata, notes, graphs and analysis results can be stored in one document. Organize your content using a flexible folder structure. Add your comments to sheets, windows and folders. To quickly find the necessary windows in the project, there is a search by string or numerical values.
Programming
Another cool feature is that Origin can be integrated with other applications using the built-in Python environment or through LabTalk, a scripting language native to Origin and optimal for simple operations such as data manipulation and task automation.
Difference in Basic or PRO versions
The utility has two versions: basic and PRO. Even the basic version has a lot of functions. Choose the version depending on your tasks. The Origin website has huge tables describing additional features in the PRO version.
For example, in the basic version, you cannot import chemical data, use the shapefile connector, and use half of the operations for mathematical analysis.
Price
There are 4 subscription options:
- Student - $ 69;
- Commercial - from $ 435;
- For government agencies and non-profit organizations - price upon request;
- Academic (for universities) - price upon request.
Origin is a versatile charting software for everyone who works with charts - from students to scientists and engineers.
The program has many functions, but it is easy to use. Therefore, you can create charts for your tasks by adjusting all the parameters.
Origin is convenient to work with due to its high import speed and the ability to create templates.